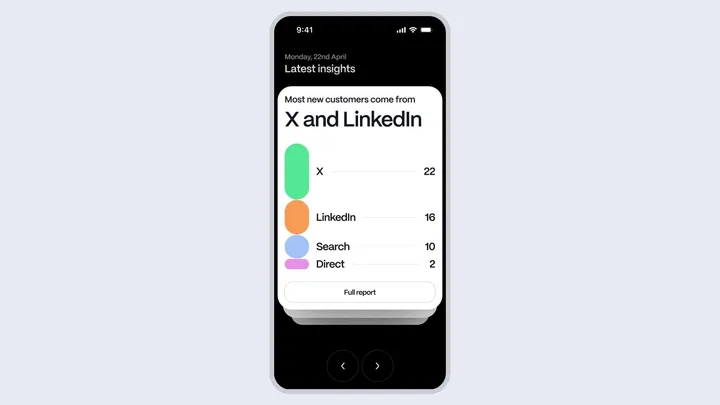
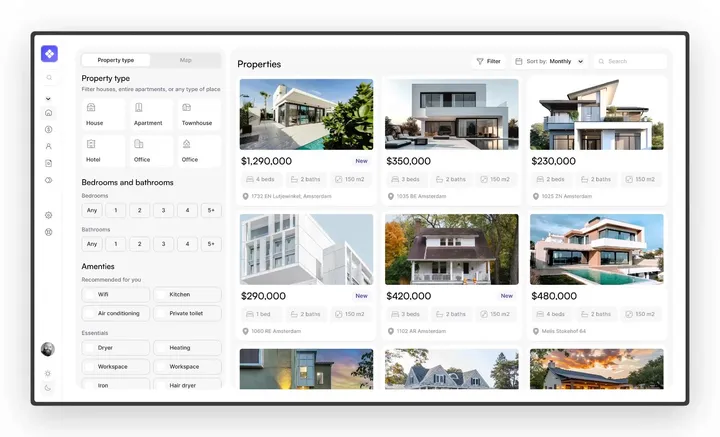
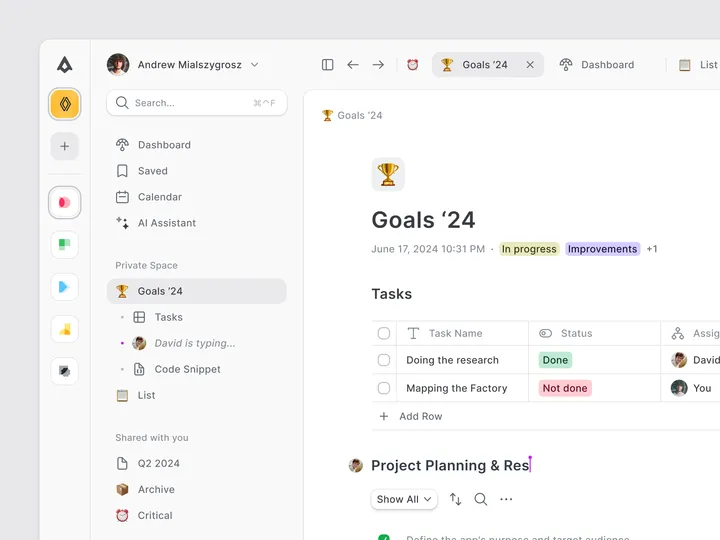
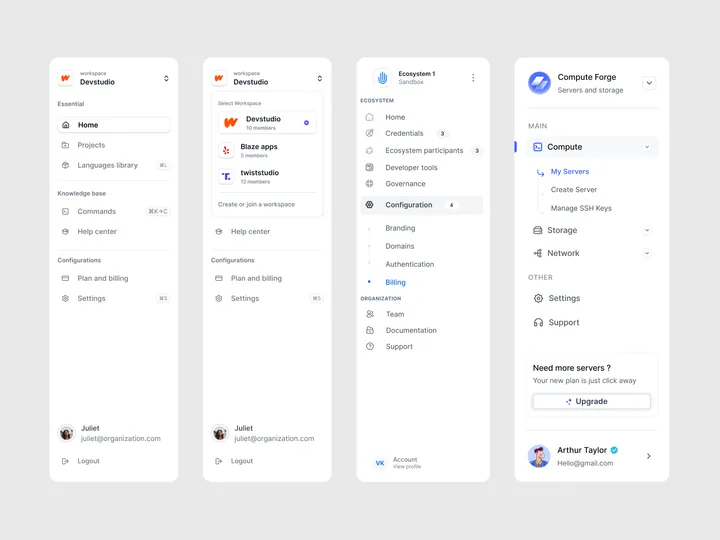
Sidebar Navigation Patterns — I'm excited to share another design pattern with you all! This one includes nested menu elements and emphasizes clarity in the current state. Enjoy and follow for more content. Need assistance with your product? Let's connect! #design #dashboard #saas

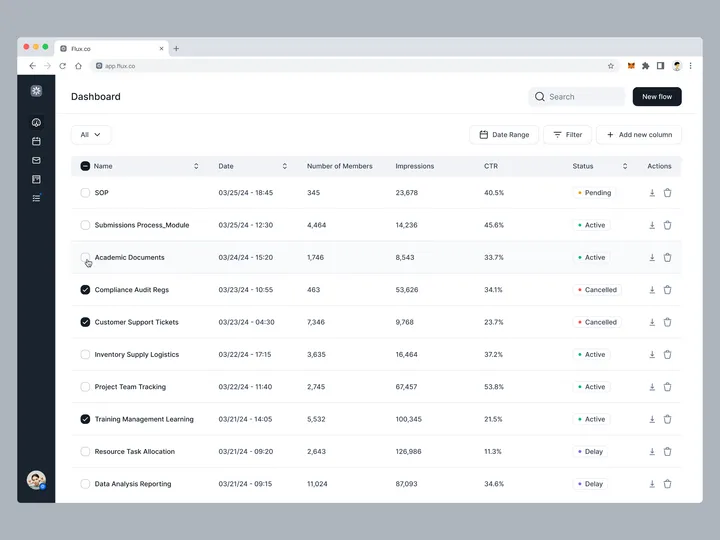
SaaS Dashboard UI — Hello 👋 This is my first design shot on Today's design. Follow me for daily screen inspiration made with Beyond UI → www.beyondui.design

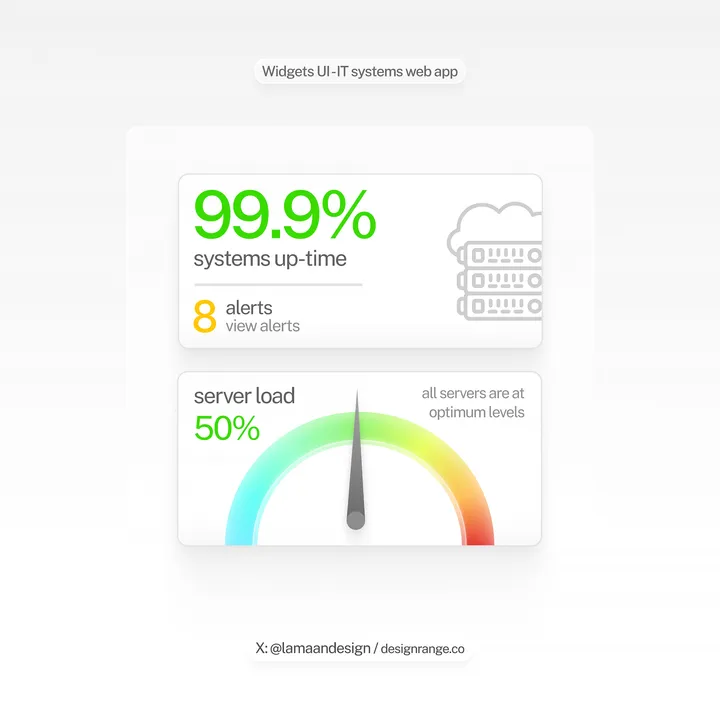
Widgets UI for an IT systems web application — Everything except the grey cloud server icon was created in Figma. Looking forward to completing this dashboard home and showing it together. - Need a high-impact design? Available for web design, UI, and visual designs. DM or email at lamaan@designrange.co

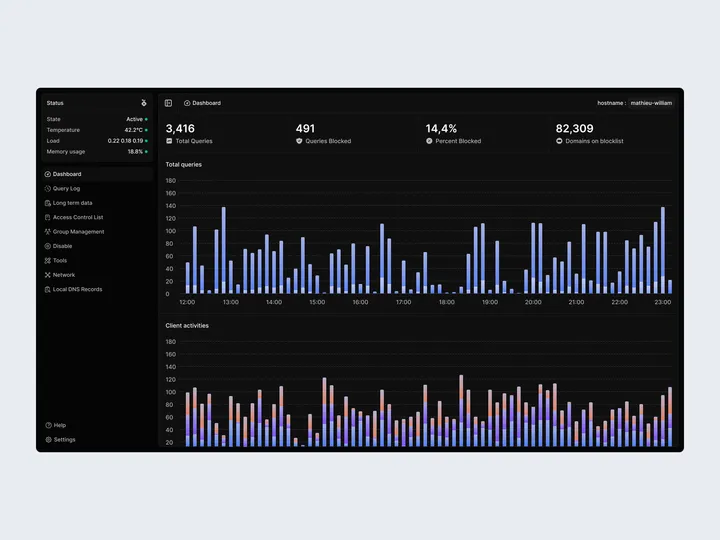
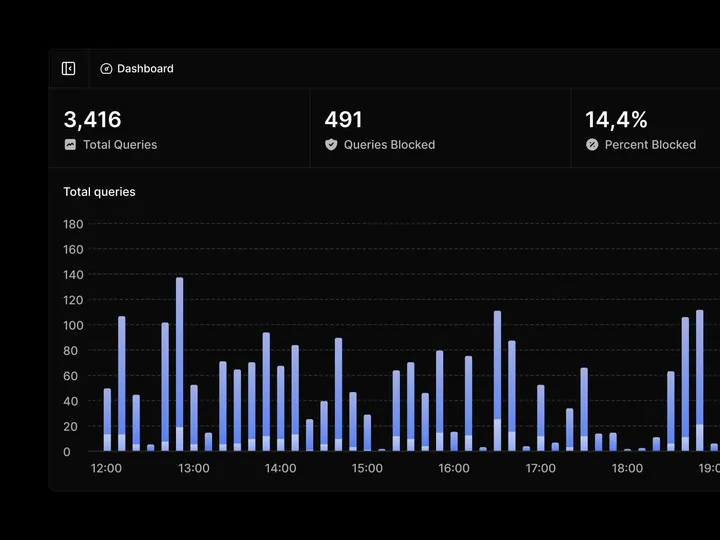
Total and Blocked Queries — A dashboard component displaying key metrics along with a bar graph showing total and blocked queries.

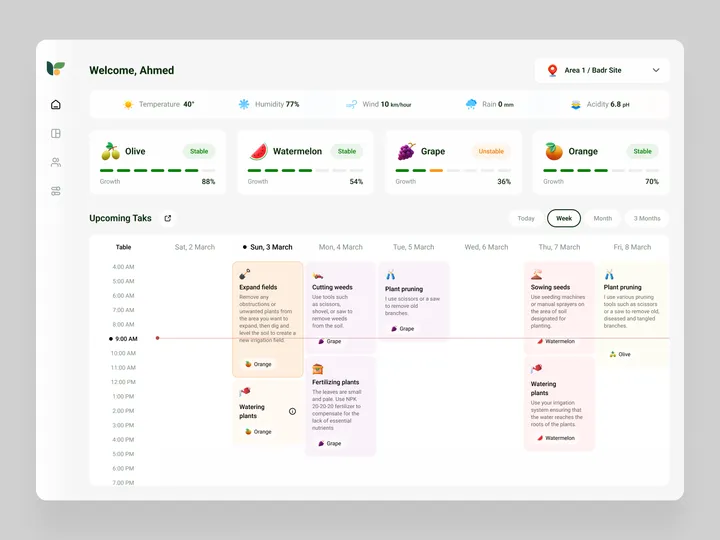
Plant Care & Tracking Dashboard — Take care of your plants, and track care schedules and reminders, Also, follow the tractors' location, agricultural records, inventory, and reports about your farm. Logo by: Wahyu Rizfi #web #dashboard #farm

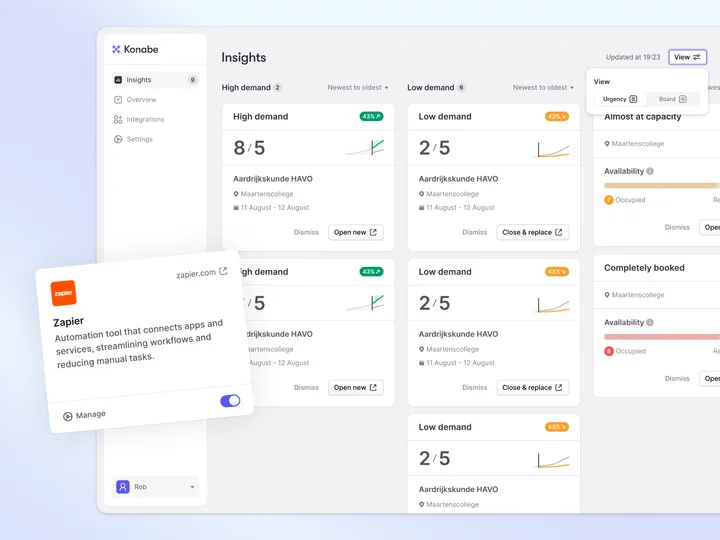
Training Demand Forecasting Dashboard — Not every idea is a success. In collaboration with two creatives I’ve worked with for over two years, we explored how to innovate the training landscape. After three months of research and testing our proposition, we gained important insights. Occupancy rates and enrollment numbers are critical factors for a training organization’s profitability. To optimize these metrics, training offerings need to be continuously aligned with demand. However, this is a complex and labor-intensive process that’s rarely done on an ongoing basis. With Konabe, you can determine the optimal training offerings in real time. This helps you increase occupancy rates, close underperforming courses, and identify new revenue opportunities. Here’s how Konabe works: Connect your sales data and training offerings to Konabe. Access insights into your current offerings via an action dashboard. Open and close courses based on demand. During development, however, questions arose around complexity, scalability, and the need for custom support. Ultimately, we decided not to proceed further with this concept, but the process was a valuable experience in “killing your darlings.” As we speak, we are now working on a new proposition.

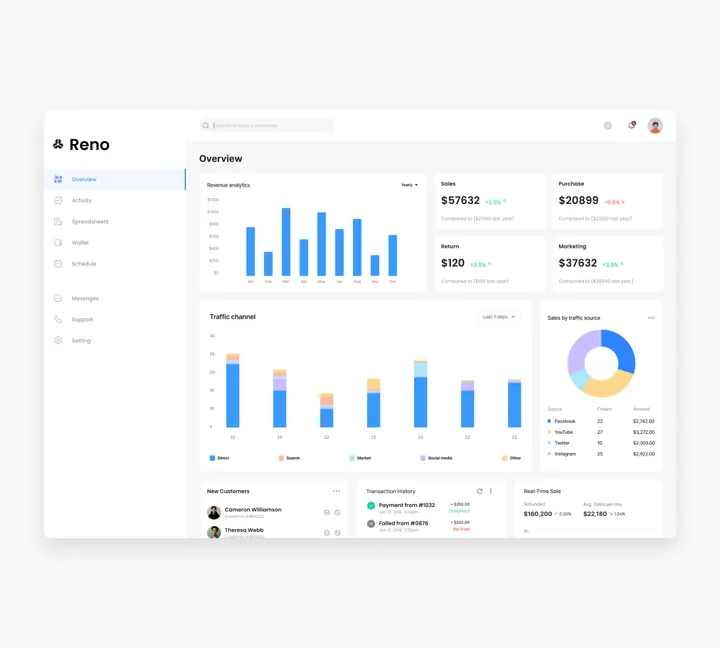
Reno dashboard — This image showcases a dashboard interface from a software named "Reno." The dashboard is designed for business analytics, displaying various metrics and data visualizations #product #dashboard #ui

