Process illustration — Concept illustration of a data analytics process that involves various tools and software.


Process illustration — Concept illustration of a data analytics process that involves various tools and software.


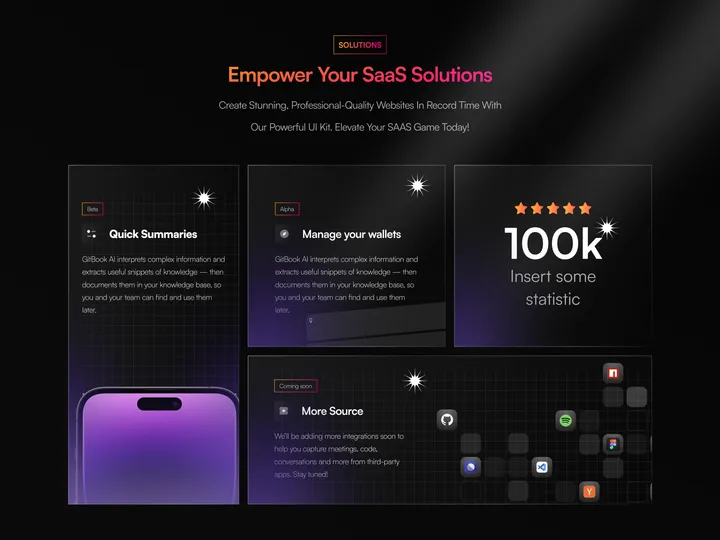
Bento Design for SaaS Website — Feature Blocks: Quick Summaries: Provides industry insights in one place, encouraging users to build upon existing knowledge. Manage Your Wallets: Offers analytic reports and smart notifications for informed decision-making. More Source: Encourages exploration and learning. Statistics Section: Positioned to the right, it showcases impressive stats to build credibility. Perspective: The design prioritizes readability, user engagement, and brand identity. Remember, as a UI/UX designer, user-centricity and intuitive navigation are paramount. These screens aim to empower users while maintaining a visually appealing experience. 🚀#web #product #bento

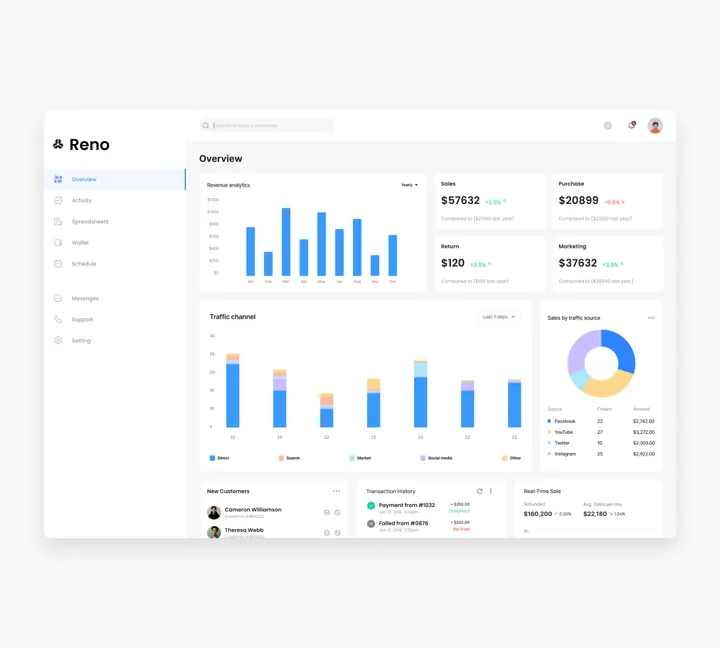
Reno dashboard — This image showcases a dashboard interface from a software named "Reno." The dashboard is designed for business analytics, displaying various metrics and data visualizations #product #dashboard #ui

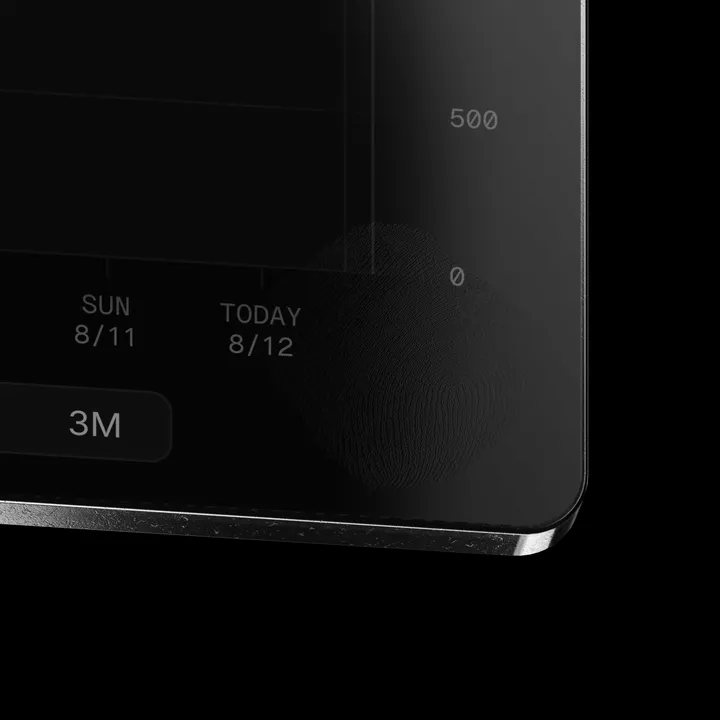
Agriculture KPI card / 01 — The first slice of a project I'm working on. #chart #analytics #product

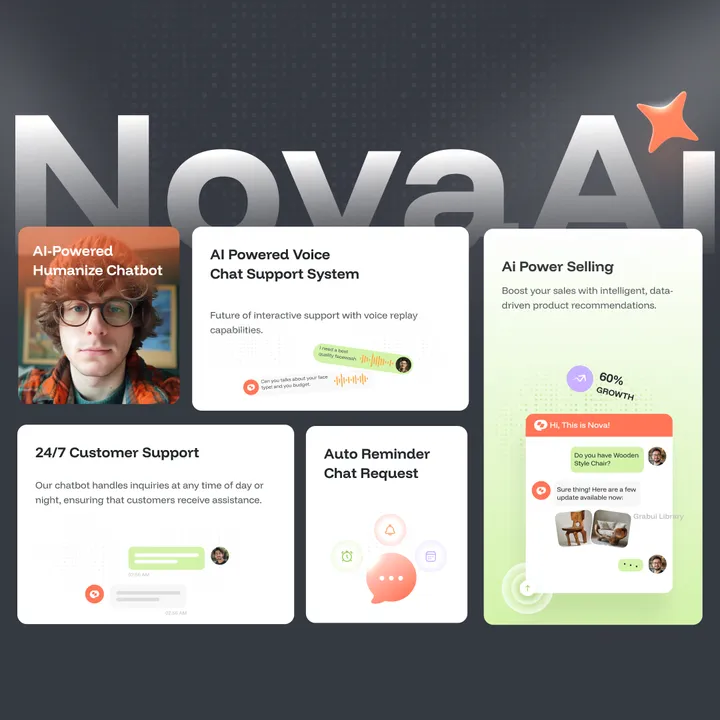
First Look at NovaAI Chatbots! 🌟 — Welcome to smarter customer engagement and seamless business automation to elevate your brand's strategy! 𝗪𝗶𝘁𝗵 𝗡𝗼𝘃𝗮𝗔𝗜 𝗖𝗵𝗮𝘁𝗯𝗼𝘁𝘀, 𝘆𝗼𝘂 𝗰𝗮𝗻: • Improve Customer Experience • Increased Efficiency • Integrate effortlessly • Gain real-time analytics 💡 Want to learn how to use tools like 𝗡𝗼𝘃𝗮𝗔𝗜 to boost conversions? Let’s connect—I’m here to help you bridge the gap between design and business strategy. #grabui #eamin_ux #web


OptiRank – The Ultimate SEO Agency Template! 🌐 — Boost your SEO agency with OptiRank, a sleek, responsive, and conversion-focused Framer template. ✨ Why OptiRank? ✅ Clean, professional design ✅ Conversion-optimized CTAs ✅ SEO-ready: fast, structured, schema-friendly ✅ Easy integrations: analytics, CRMs, forms ✅ Fully customizable (Framer/Webflow + Figma) ✅ Lifetime support & updates Perfect for startups or agencies to attract clients and grow. 👉 Get it now: grabui.com/product/optirank #seoagency #digitalmarketing #businessgrowth


Introducing NovaChat Website Template — NovaChat by NovaAI is an AI-powered solution designed to revolutionize customer engagement and operational efficiency. Leveraging advanced Natural Language Processing (NLP) and machine learning, NovaChat delivers instant, accurate responses to customer inquiries, handles FAQs, processes orders, and provides real-time analytics—24/7. #webdesign #saas #ai SAAS

OptiRise: The Webflow -Approved Template Built t — Your SEO & marketing agency deserves a website that works as hard as you do. OptiRise is a performance-driven template designed to: ✅ Dominate SEO – Built-in best practices to rank higher, faster ✅ Convert Visitors – Strategic layouts designed for lead generation ✅ Impress Clients – Sleek, professional showcase for your portfolio & services ✅ Integrate Effortlessly – CRM, analytics, and tools ready to connect ✅ Launch in Minutes – Customizable templates, no coding needed 👉 shm.to/qQ9OaSi #seoagency #webflowexperts #highconverting

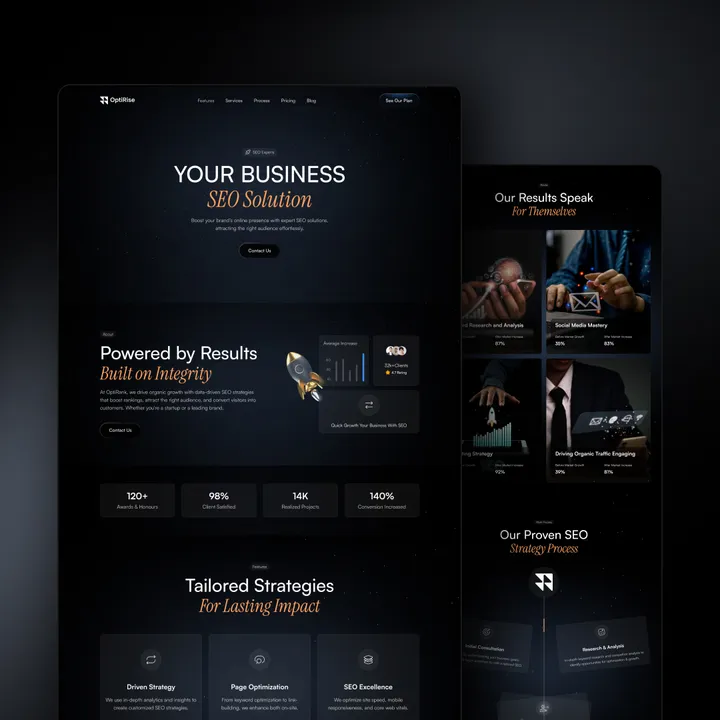
OptiRise – The Webflow Approved Design — Your SEO and marketing agency needs more than just a good-looking website — it needs one that drives results. OptiRise is a high-performance Webflow template built to help you scale with ease. 🔍 SEO-Optimized – Built-in best practices to boost your rankings faster 🎯 Lead-Focused Design – Proven layouts that convert visitors into clients ✨ Client-Ready Look – Professional, clean design to showcase your services and portfolio 🔗 Tool-Friendly – Seamlessly integrates with CRMs, analytics, and marketing tools ⚡ Quick Launch – Fully customizable with zero coding required 👉 Start growing today: shm.to/OptiRise-29-04-2025 #seoagency #webflowtemplate #leadgeneration

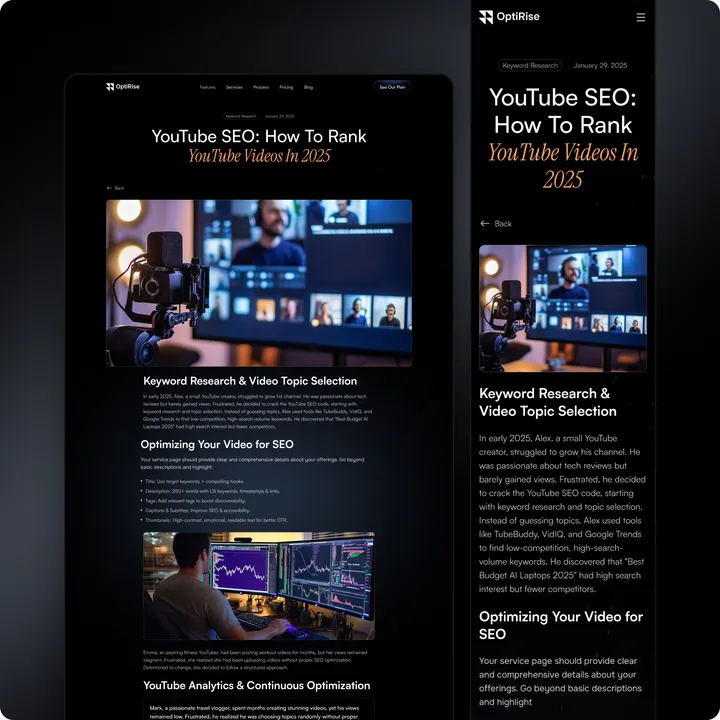
OptiRise — The Webflow -Approved Design. — Your SEO and marketing agency deserves more than just a good-looking website — it needs a site that drives results. OptiRise is a high-performance Webflow template designed to help you scale, convert, and impress. 🔍 SEO-Optimized — Built-in best practices to boost your search rankings 🎯 Conversion-Focused Design — Proven layouts that turn visitors into clients ✨ Client-Ready Aesthetic — Sleek, professional design to showcase your services and portfolio 🔗 Tool-Friendly — Effortless integration with CRMs, analytics, and marketing platforms ⚡ Fast & Flexible Launch — Fully customizable, no coding required 👉 Get started today: shm.to/OptiRise-29-04-2025 #seoagency #webflowtemplate #conversionfocused

